BuyingSelling November 9, 2022

What’s Ahead for Mortgage Rates and Home Prices?

What’s Ahead for Mortgage Rates and Home Prices?

What’s Ahead for Mortgage Rates and Home Prices? | MyKCM

Now that the end of 2022 is within sight, you may be wondering what’s going to happen in the housing market next year and what that may mean if you’re thinking about buying a home. Here’s a look at the latest expert insights on both mortgage rates and home prices so you can make your best move possible.

Mortgage Rates Will Continue To Respond to Inflation

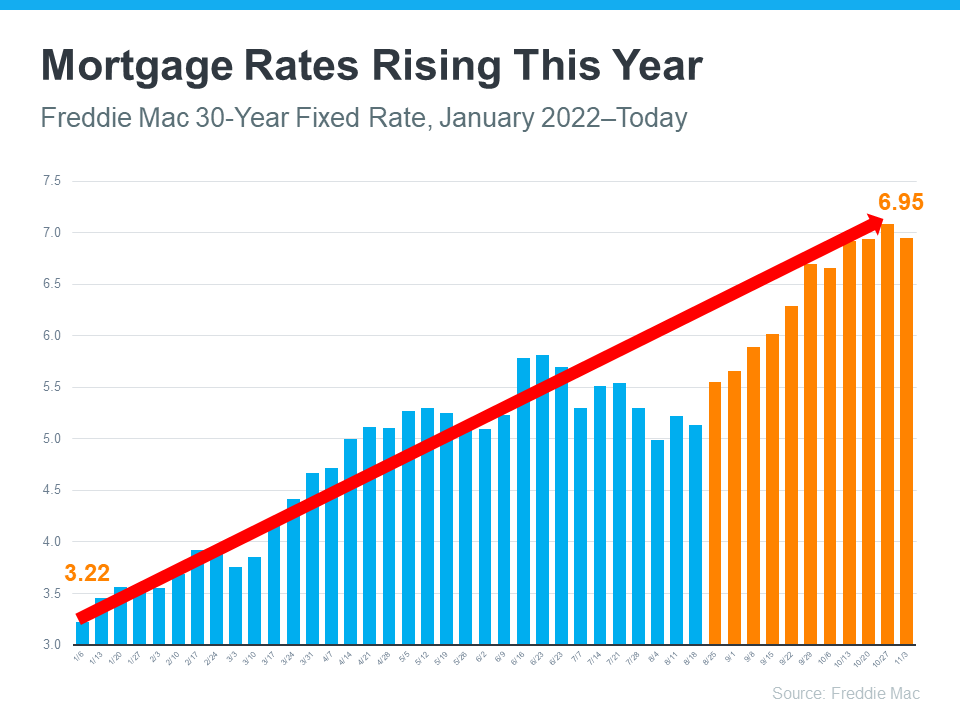
There’s no doubt mortgage rates have skyrocketed this year as the market responded to high inflation. The increases we’ve seen were fast and dramatic, and the average 30-year fixed mortgage rate even surpassed 7% at the end of last month. In fact, it’s the first time they’ve risen this high in over 20 years (see graph below):

What’s Ahead for Mortgage Rates and Home Prices? | MyKCM

In their latest quarterly report, Freddie Mac explains just how fast the climb in rates has been:

“Just one year ago, rates were under 3%. This means that while mortgage rates are not as high as they were in the 80’s, they have more than doubled in the past year. Mortgage rates have never doubled in a year before.

Because we’re in unprecedented territory, it’s hard to say with certainty where mortgage rates will go from here. Projecting the future of mortgage rates is far from an exact science, but experts do agree that, moving forward, mortgage rates will continue to respond to inflation. If inflation stays high, mortgage rates likely will too.

Home Price Changes Will Vary by Market

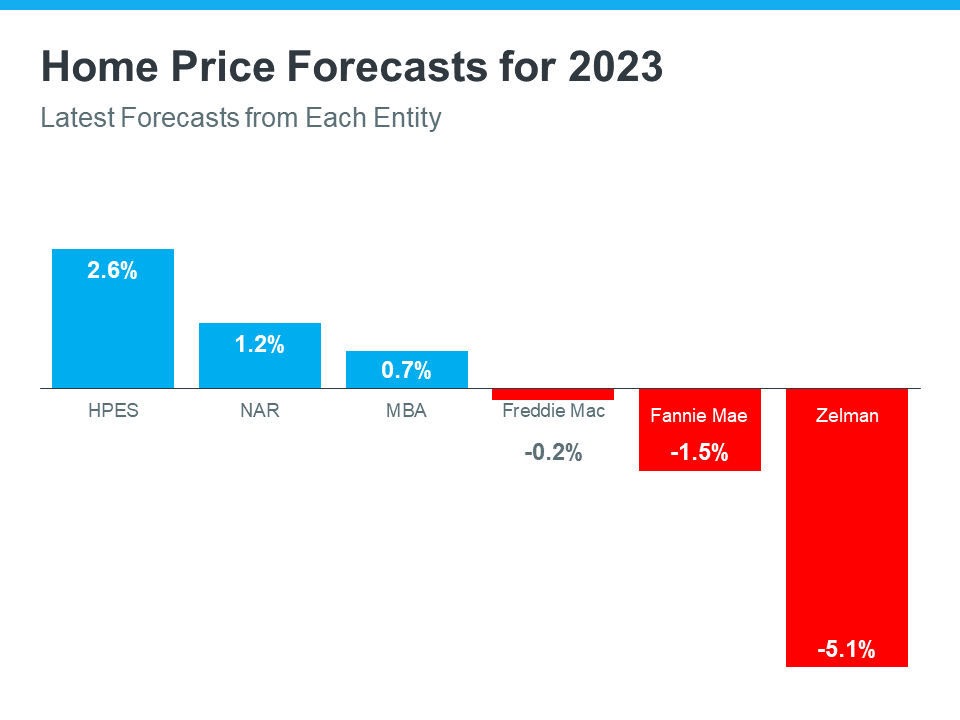
As buyer demand has eased this year in response to those higher mortgage rates, home prices have moderated in many markets too. In terms of the forecast for next year, expert projections are mixed. The general consensus is home price appreciation will vary by local market, with more significant changes happening in overheated areas. As Mark Fleming, Chief Economist at First American, says:

“House price appreciation has slowed in all 50 markets we track, but the deceleration is generally more dramatic in areas that experienced the strongest peak appreciation rates.

Basically, some areas may still see slight price growth while others may see slight price declines. It all depends on other factors at play in that local market, like the balance between supply and demand. This may be why experts are divided on their latest national forecasts (see graph below):

What’s Ahead for Mortgage Rates and Home Prices? | MyKCM

Bottom Line

If you want to know what’s happening with home prices or mortgage rates, let’s connect so you have the latest on what experts are saying and what that means for our area.

BuyingSelling October 27, 2022

3 Graphs Showing Why Today’s Housing Market Isn’t Like 2008

3 Graphs Showing Why Today’s Housing Market Isn’t Like 2008

3 Graphs Showing Why Today’s Housing Market Isn’t Like 2008 | MyKCM

With all the headlines and talk in the media about the shift in the housing market, you might be thinking this is a housing bubble. It’s only natural for those thoughts to creep in that make you think it could be a repeat of what took place in 2008. But the good news is, there’s concrete data to show why this is nothing like the last time.

There’s Still a Shortage of Homes on the Market Today, Not a Surplus

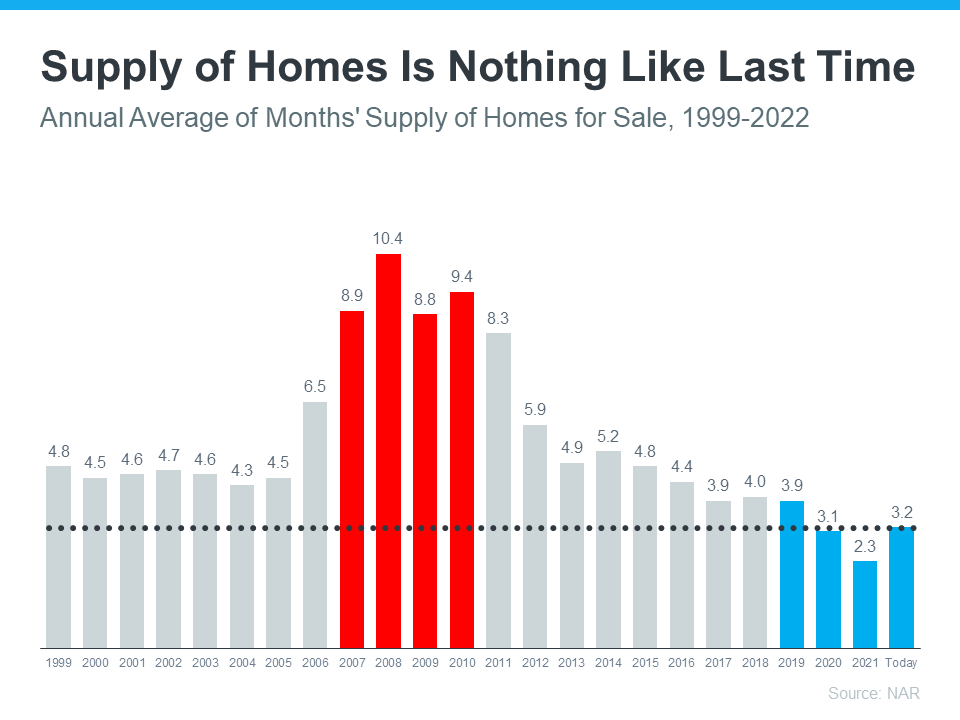
For historical context, there were too many homes for sale during the housing crisis (many of which were short sales and foreclosures), and that caused prices to fall dramatically. Supply has increased since the start of this year, but there’s still a shortage of inventory available overall, primarily due to almost 15 years of underbuilding homes.

The graph below uses data from the National Association of Realtors (NAR) to show how the months’ supply of homes available now compares to the crash. Today, unsold inventory sits at just a 3.2-months’ supply at the current sales pace, which is significantly lower than the last time. There just isn’t enough inventory on the market for home prices to come crashing down like they did last time, even though some overheated markets may experience slight declines.

3 Graphs Showing Why Today’s Housing Market Isn’t Like 2008 | MyKCM

Mortgage Standards Were Much More Relaxed Back Then

During the lead-up to the housing crisis, it was much easier to get a home loan than it is today. Running up to 2006, banks were creating artificial demand by lowering lending standards and making it easy for just about anyone to qualify for a home loan or refinance their current home.

Back then, lending institutions took on much greater risk in both the person and the mortgage products offered. That led to mass defaults, foreclosures, and falling prices. Today, things are different, and purchasers face much higher standards from mortgage companies.

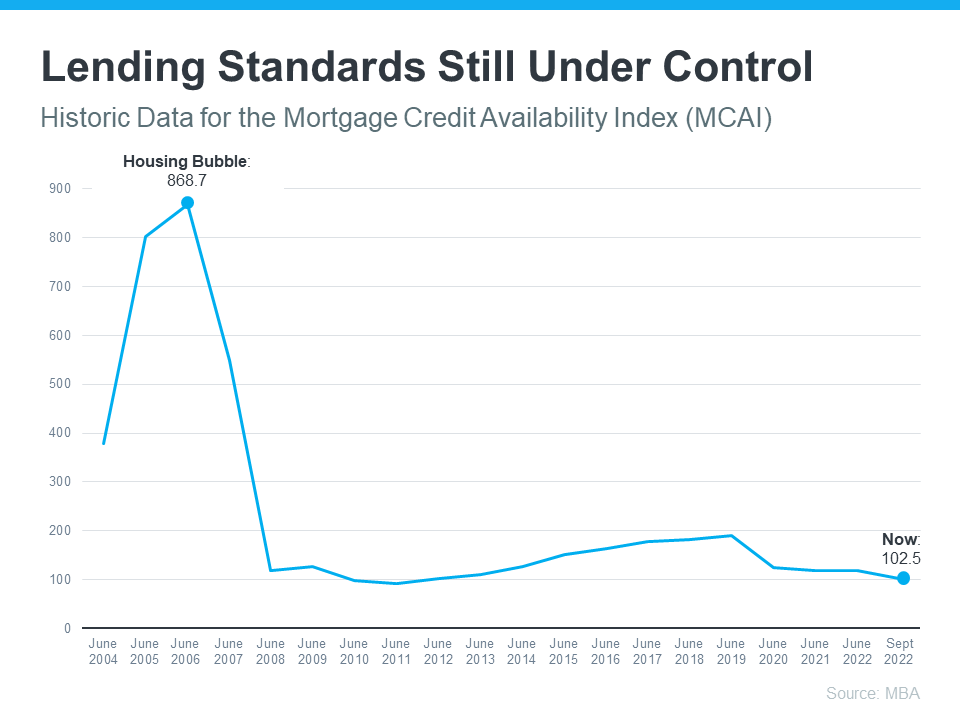
The graph below uses Mortgage Credit Availability Index (MCAI) data from the Mortgage Bankers Association (MBA) to help tell this story. In that index, the higher the number, the easier it is to get a mortgage. The lower the number, the harder it is. In the latest report, the index fell by 5.4%, indicating standards are tightening.

3 Graphs Showing Why Today’s Housing Market Isn’t Like 2008 | MyKCM

This graph also shows just how different things are today compared to the spike in credit availability leading up to the crash. Tighter lending standards over the past 14 years have helped prevent a scenario that would lead to a wave of foreclosures like the last time.

The Foreclosure Volume Is Nothing Like It Was During the Crash

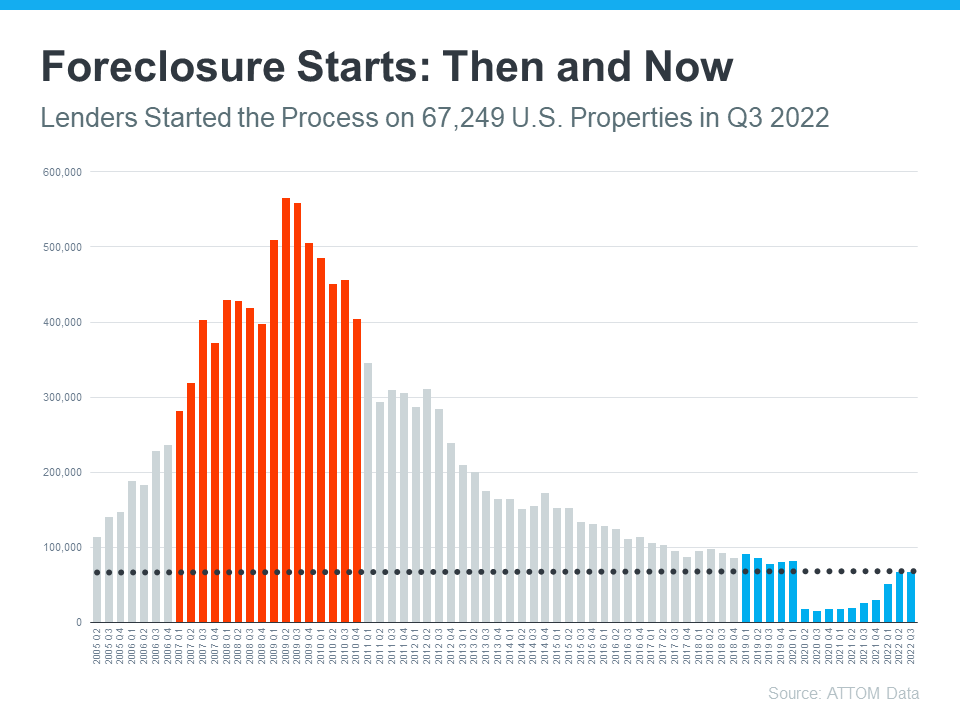
Another difference is the number of homeowners that were facing foreclosure after the housing bubble burst. Foreclosure activity has been lower since the crash, largely because buyers today are more qualified and less likely to default on their loans. The graph below uses data from ATTOM Data Solutions to help paint the picture of how different things are this time:

3 Graphs Showing Why Today’s Housing Market Isn’t Like 2008 | MyKCM

Not to mention, homeowners today have options they just didn’t have in the housing crisis when so many people owed more on their mortgages than their homes were worth. Today, many homeowners are equity rich. That equity comes, in large part, from the way home prices have appreciated over time. According to CoreLogic:

“The total average equity per borrower has now reached almost $300,000, the highest in the data series.”

Rick Sharga, Executive VP of Market Intelligence at ATTOM Dataexplains the impact this has:

“Very few of the properties entering the foreclosure process have reverted to the lender at the end of the foreclosure. . . . We believe that this may be an indication that borrowers are leveraging their equity and selling their homes rather than risking the loss of their equity in a foreclosure auction.”

 This goes to show homeowners are in a completely different position this time. For those facing challenges today, many have the option to use their equity to sell their house and avoid the foreclosure process.

Bottom Line

If you’re concerned we’re making the same mistakes that led to the housing crash, the graphs above should help alleviate your fears. Concrete data and expert insights clearly show why this is nothing like the last time.

BuyingSelling October 20, 2022

The Latest on Supply and Demand in Housing

The Latest on Supply and Demand in Housing

The Latest on Supply and Demand in Housing | MyKCM

Over the past two years, the substantial imbalance of low housing supply and high buyer demand pushed home sales and buyer competition to new heights. But this year, things are shifting as supply and demand reach an inflection point.

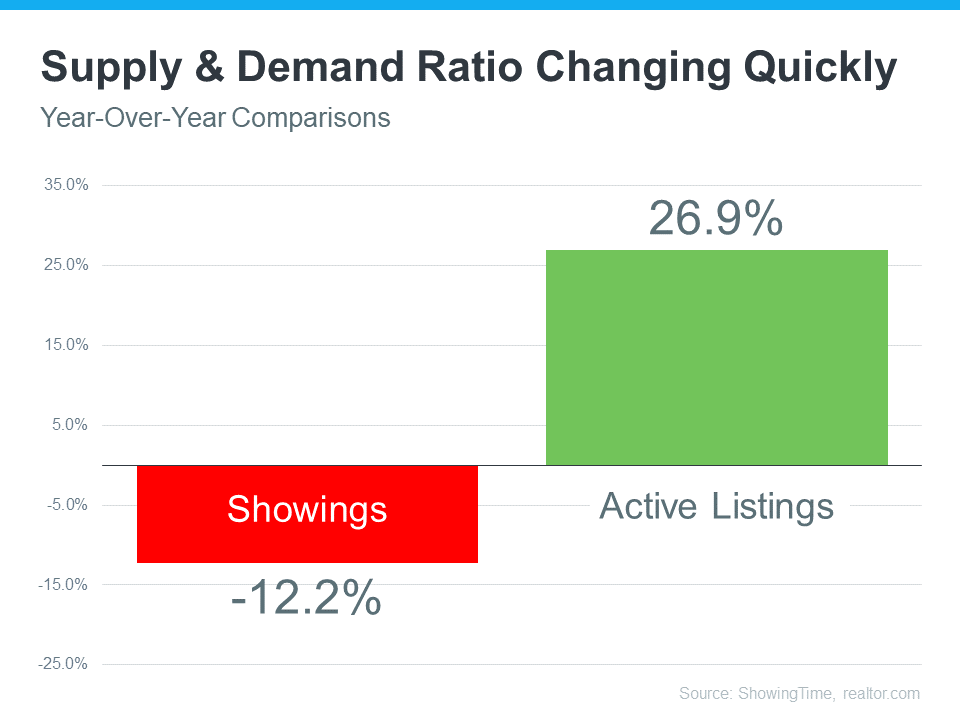
The graph below helps tell the story of just how different things are today.

The Latest on Supply and Demand in Housing | MyKCM

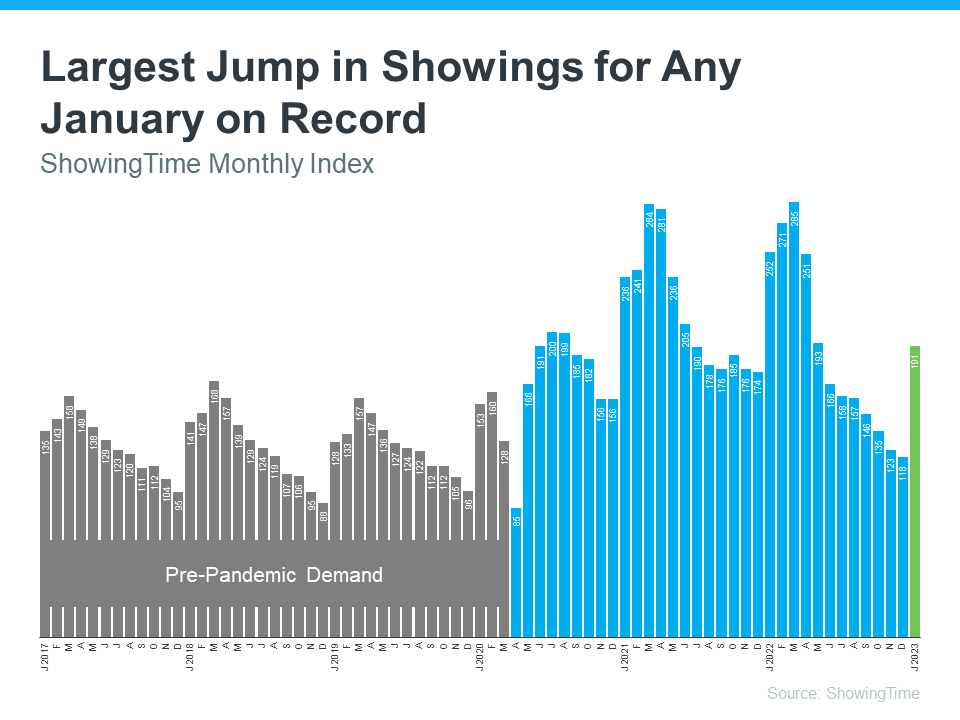
This year, buyer demand has eased as higher mortgage rates and mounting economic uncertainty moderated the market. This slowdown in demand is clear when you look at the red bar on the graph. It uses the latest data from ShowingTime to illustrate how showings (an indicator of buyer demand) have softened by just over 12% compared to the same time last year.

Now for a look at how housing supply has changed, turn to the green bar. It uses data from realtor.com to show active listings are up nearly 27% compared to last year. That’s because the moderation of demand allowed housing inventory to increase in 2022.

What Does This Inflection Point Mean for Buyers?

If you’re thinking of buying a home, you’ll have less competition and more options than you would have had last year. Enjoy having more homes to choose from in your home search and lean on a trusted real estate professional to understand how the increase in supply has also increased your negotiation power. That professional can talk you through the opportunities and challenges buyers face in today’s shifting market. You may be surprised to find they’re different than they were a year ago.

What Does This Inflection Point Mean for Sellers?

If you’re looking to sell your house, know that inventory is still low overall. That means, if you work with an agent to price your house based on current market value, it will still sell despite the inventory gains and moderating buyer demand this year. That’s because there are still buyers out there who want to move, and your house may be exactly what they’re looking for.

Bottom Line

If you’re thinking of buying or selling a home, the best place to turn to for information on today’s supply and demand is a trusted real estate professional. Let’s connect so you know what’s happening in our local market and what that means for you.

Buying October 1, 2022

Why You Should Consider Condos as Part of Your Home Search

Why You Should Consider Condos as Part of Your Home Search

Why You Should Consider Condos as Part of Your Home Search | MyKCM

The historically low inventory over the past few years led to challenges for many buyers trying to find a home that met their needs and their budget. If you’re in the same boat, you should know the recent shift in the housing market may have opened up doors for you to restart your search.

The inventory of homes for sale has increased this year, and that’s giving buyers much needed options. As Danielle Hale, Chief Economist at realtor.comsays:

“. . . today’s shoppers have more than 5 homes to consider for every 4 they had at this time a year ago.”

But perspective is important. Overall, housing supply is still low. If you need even more choices, expanding your search by adding additional housing types, like condominiums, could help.

Exploring Condos Could Add Options That Fit Your Budget

One thing to consider is condos generally differ from single-family homes in average space and floorplans. But that size difference is one reason why condos can be a more affordable option. According to a recent report from realtor.com, condo buyers paid roughly 7% less for their home than buyers of other housing types last year. With rising mortgage rates and home prices, the relative affordability of a condo could be worth considering.

Remember, your first home doesn’t have to be your forever home. The important thing is to get your foot in the door as a homeowner. Buying a condo now can springboard you into a bigger home later on. An article from the Urban Institute explains:

Because condos and co-ops are generally more affordable, they tend to help first-time homebuyers step onto the first rung of the homeownership ladder. These buyers often use the equity on their condo to then purchase a larger single-family home.

In other words, owning a condo will help you start building wealth in the form of home equity. In time, the equity you build can fuel a future purchase should you decide you want to buy a home with more space or different amenities.

Condo Living Provides Several Great Perks

Boosting the number of options in your budget during your home search is just one reason to consider condos, but there are several other benefits to condo living.

First, they tend to require minimal upkeep and lower maintenance – and that can give you more time to spend doing the things you enjoy. A recent article from Bankrate highlights this, saying:

Condos can be a good option for anyone who wants to keep home maintenance to a minimum . . . if the roof is leaking or the carpet in the lobby needs to be replaced, that’s not your responsibility — the condo association handles those duties.”

Plus, since many condos are located in or near city centers, they offer the added benefit of being in close proximity to work and leisure. Again, realtor.com explains:

“Buying a condo, which is generally less expensive than a single-family home, enables a household to afford to own in the middle of it all, and often means a newer-built home with less maintenance responsibility.”

Ultimately, owning and living in a condo can be a lifestyle choice. And if that appeals to you, they could give you the added options you need to buy your first home.

Bottom Line

Adding condominiums to your housing search could be a great move. If you’re ready to search condos in our area, let’s connect today.

BuyingSelling September 14, 2022

Is the Real Estate Market Slowing Down, or Is This a Housing Bubble?

Is the Real Estate Market Slowing Down, or Is This a Housing Bubble?

Is the Real Estate Market Slowing Down, or Is This a Housing Bubble? | MyKCM

The talk of a housing bubble in the coming year seems to be at a fever pitch as rising mortgage rates continue to slow down an overheated real estate market. Over the past two years, home prices have appreciated at an unsustainable pace causing many to ask: are things just slowing down, or is a crash coming?

To answer this question, there are two things we want to understand. The first is the reality of the shift in today’s housing market. And the second is what experts are saying about home prices in the coming year.

The Reality of the Shift in Today’s Housing Market

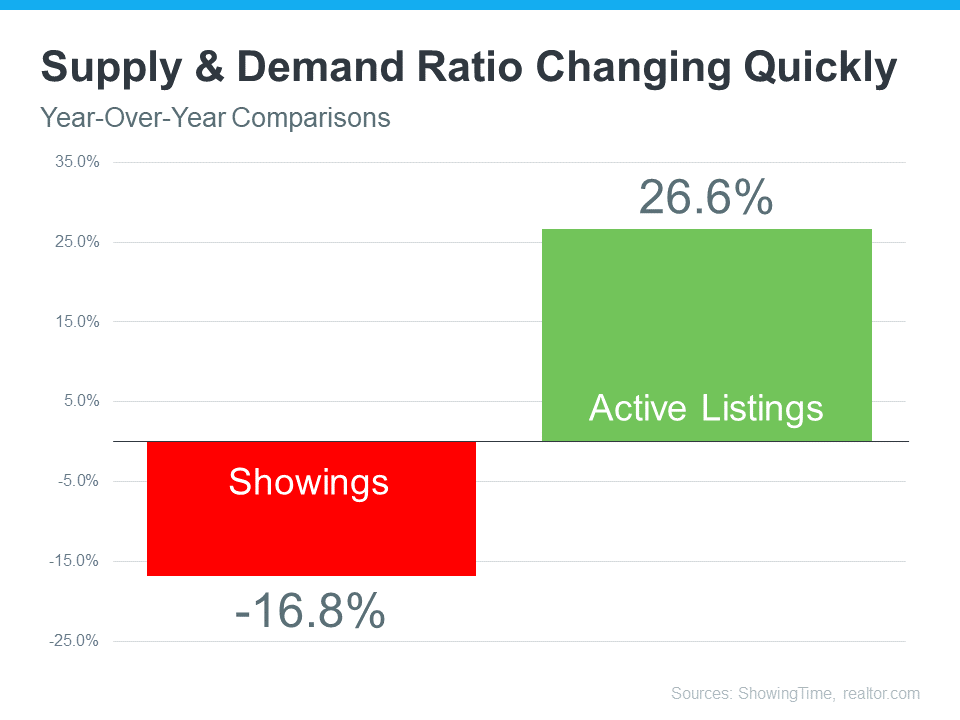
The reality is we’re seeing an inflection point in housing supply and demand. According to realtor.com, active listings have increased more than 26% over last year, while showings from the latest ShowingTime Showing Index have decreased almost 17% from last year (see graph below). This is an inflection point for housing because, over the past two years, we’ve seen a massive amount of demand (showings) and not enough homes available for sale for the number of people that wanted to buy. That caused the market frenzy.

Today, supply and demand look very different, and the market is slowing down from the pace we’ve seen. This offers proof of the sudden slowdown so many people are feeling.

Is the Real Estate Market Slowing Down, or Is This a Housing Bubble? | MyKCM

What Experts Are Saying About Home Prices in the Coming Year

Right now, most experts are forecasting home price appreciation in 2023, but at a much slower pace than the last two years. The average of the six forecasters below is for national home prices to appreciate by 2.5% in the coming year. Only one of the six is calling for home price depreciation.

Is the Real Estate Market Slowing Down, or Is This a Housing Bubble? | MyKCM

When we look at the shift taking place along with what experts are saying, we can conclude the national real estate market is slowing down but is not a bubble getting ready to burst. This isn’t to say that a few overheated markets won’t experience home price depreciation, but there isn’t a case to be made for a national housing bubble.

Bottom Line

The real estate market is slowing down, and that’s causing many to fear we’re in a housing bubble. What we’ve experienced in the housing market over the past two years were historic levels of demand and constrained supply. That led to homes going up in value at a record pace. While some overheated markets may experience price depreciation in the short term, according to experts, the national real estate market will appreciate in the coming year.

Buying September 9, 2022

Expert Forecasts on Mortgage Rates

Expert Forecasts on Mortgage Rates

Expert Forecasts on Mortgage Rates | MyKCM

If you’ve been thinking of buying a home, you may have been watching what’s happened with mortgage rates over the past year. It’s true they’ve risen dramatically, but where will they go from here, especially as the market continues to slow?

As you think about your homeownership goals and decide if now’s the time to make your move, the best place to turn to for that information is the professionals. Here’s a summary of the latest mortgage rate forecasts from housing market experts.

Experts Project Mortgage Rates Will Stabilize

While mortgage rates continue to fluctuate due to ongoing inflationary pressures and economic uncertainty, experts project they’ll start to stabilize in the months ahead. According to the latest projections, mortgage rates are expected to hover in the low to mid 5% range initially, and then potentially dip into the high 4% range by later next year (see chart below):

Expert Forecasts on Mortgage Rates | MyKCM

That could bring you some welcome relief. So far this year, mortgage rates have climbed over two percentage points due to the Federal Reserve’s response to inflation, and that’s made it more expensive to buy a home. And wondering if the rise in rates will continue is keeping some prospective buyers on the sidelines.

But now that experts say mortgage rates should stabilize, this gives you a bit more certainty about what they think the future holds, and that may help you feel more confident about your decision to buy a home.

Bottom Line

Whether you’re looking to buy your first home, move up to a larger home, or even downsize, you need to know what’s happening in the housing market so you can make the most informed decision possible. Let’s connect to discuss your goals and determine the best plan for your move.

Buying August 31, 2022

Buyers: You May Face Less Competition as Bidding Wars Ease

Buyers: You May Face Less Competition as Bidding Wars Ease

Buyers: You May Face Less Competition as Bidding Wars Ease | MyKCM

One of the top stories in recent real estate headlines was the intensity and frequency of bidding wars. With so many buyers looking to purchase a home and so few of them available for sale, fiercely competitive bidding wars became the norm during the pandemic – and it drove home prices up. If you tried to buy a house over the past two years, you probably experienced this firsthand and may have been outbid on several homes along the way.

But here’s the news you’ve been waiting for: data shows clear signs bidding wars are easing this year.

According to the National Association of Realtors (NAR), the average number of offers on recently sold homes has declined considerably over the past few months (see graph below):

Buyers: You May Face Less Competition as Bidding Wars Ease | MyKCM

The graph shows homes were seeing a high of around five offers earlier this year. But the latest data shows that average was down to just shy of three offers per recently sold home. This shift is happening largely because rising mortgage rates moderated buyer demand and slowed home sales, resulting in a growing supply of homes on the market. Essentially, more choices for buyers.

What This Means for You

If you put your home search on pause because you were outbid last year or because you didn’t want to deal with the peak intensity of bidding wars, you can breathe a welcome sigh of relief. While it’s still a sellers’ market, an uptick in inventory gives you a window of opportunity to jump back in. You may still be competing with some buyers, but it likely won’t be anything like it was just a few short months ago.

Bottom Line

If you put your plans on pause because of intense bidding wars in recent years, it may be time to kick off your home search. Today, bidding wars are easing and that may mean less competition for you as a buyer. If you’re serious about buying a home or making a move, let’s connect to get started today.

Buying August 17, 2022

The U.S. Homeownership Rate Is Growing

The U.S. Homeownership Rate Is Growing

The U.S. Homeownership Rate Is Growing | MyKCM

The desire to own a home is still strong today. In fact, according to the Census, the U.S. homeownership rate is on the rise. To illustrate the increase, the graph below shows the homeownership rate over the last year:

The U.S. Homeownership Rate Is Growing | MyKCM

That data shows more than half of the U.S. population live in a home they own, and the percentage is growing with time.

If you’re thinking about buying a home this year, here are just a few reasons why so many people see the value of homeownership.

Why Are More People Becoming Homeowners?

There are several benefits to owning your home. A significant one, especially when inflation is high like it is today, is that homeownership can help protect you from rising costs. Lawrence Yun, Chief Economist at the National Association of Realtors (NAR), explains:

“In the 1970s, when inflation was running around 10%, home prices were rising at approximately the same rate. Renters actually have a harder time in inflationary periods, because rents tend to rise along with inflation, whereas mortgage payments stay the same for homeowners with fixed-rate mortgages.”

When you buy a home with a fixed-rate mortgage, you can lock in what’s likely your biggest monthly expense – your housing payment – for the duration of that loan, often 15-30 years.

That gives you a predictable monthly housing expense that can benefit you in the short term, but you’ll also gain equity over time as your home appreciates in value and you make your monthly mortgage payment.

And with that growing equity, your net worth will increase as well. In fact, the latest data from NAR shows the median household net worth of a homeowner is roughly $300,000, while the median net worth of renters is only about $8,000. That means a homeowner’s net worth is nearly 40 times that of a renter.

The U.S. Homeownership Rate Is Growing | MyKCM

Bottom Line

The U.S. homeownership rate is growing. If you’re ready to purchase the home of your dreams, let’s connect so you can begin the homebuying process today.

Buying August 10, 2022

Is the Shifting Market a Challenge or an Opportunity for Homebuyers?

Is the Shifting Market a Challenge or an Opportunity for Homebuyers?

Is the Shifting Market a Challenge or an Opportunity for Homebuyers? | MyKCM

If you tried to buy a home during the pandemic, you know the limited supply of homes for sale was a considerable challenge. It created intense bidding wars which drove home prices up as buyers competed with one another to be the winning offer.

But what was once your greatest challenge may now be your greatest opportunity. Today, data shows buyer demand is moderating in the wake of higher mortgage rates. Here are a few reasons why this shift in the housing market is good news for your homebuying plans.

The Challenge

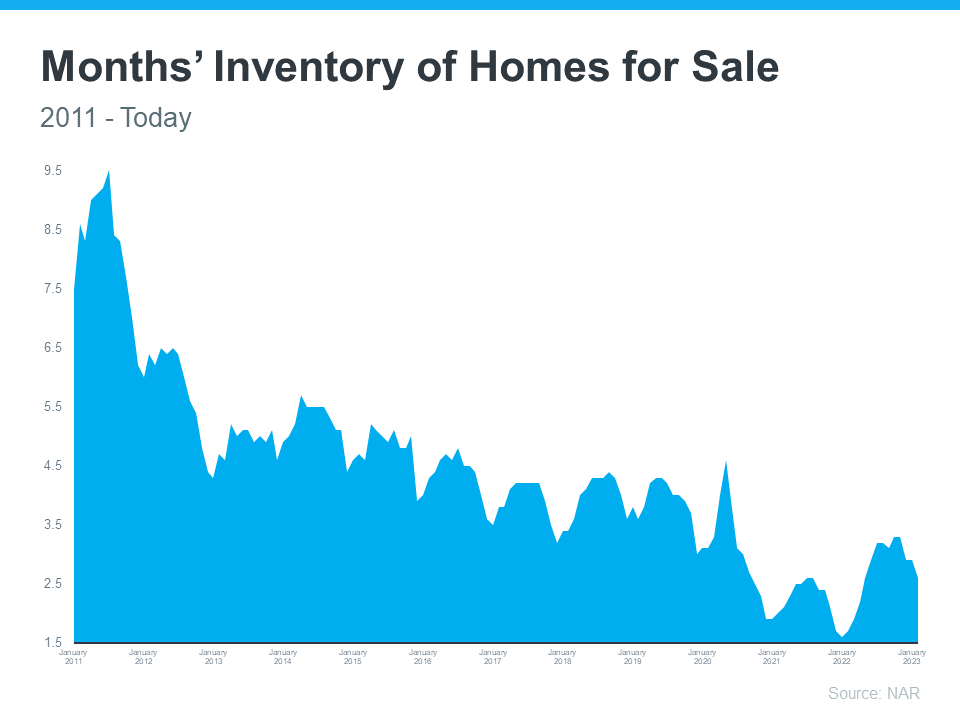
There were many reasons for the limited number of homes on the market during the pandemic, including a history of underbuilding new homes since the market crash in 2008. As the graph below shows, housing supply is well below what the market has seen for most of the past 10 years (see graph below):

Is the Shifting Market a Challenge or an Opportunity for Homebuyers? | MyKCM

The Opportunity

But that graph also shows a trend back up in the right direction this year. That’s because moderating demand is slowing the pace of home sales and that’s one of the reasons housing supply is finally able to grow. For you, that means you’ll have more options to choose from, so it shouldn’t be as difficult to find your next home as it has been recently.

And having more options may also lead to less intense bidding wars. Data from the Realtors Confidence Index from the National Association of Realtors (NAR) shows this trend has already begun. In their recent reports, bidding wars are easing month-over-month (see graph below):

Is the Shifting Market a Challenge or an Opportunity for Homebuyers? | MyKCM

If you’ve been outbid before or you’ve struggled to find a home that meets your needs, breathe a welcome sigh of relief. The big takeaway here is you have more options and less competition today.

Just remember, while easing, data shows multiple-offer scenarios are still happening – they’re just not as intense as they were over the past year. You should still lean on an agent to guide you through the process and help you make your strongest offer up front.

Bottom Line

If you’re still looking to make a move, it may be time to pick your home search back up today. Let’s connect to kick off the homebuying process.

BuyingSelling August 2, 2022

3 Graphs To Show This Isn’t a Housing Bubble

3 Graphs To Show This Isn’t a Housing Bubble

3 Graphs To Show This Isn’t a Housing Bubble | MyKCM

With all the headlines and buzz in the media, some consumers believe the market is in a housing bubble. As the housing market shifts, you may be wondering what’ll happen next. It’s only natural for concerns to creep in that it could be a repeat of what took place in 2008. The good news is, there’s concrete data to show why this is nothing like the last time.

There’s a Shortage of Homes on the Market Today, Not a Surplus

The supply of inventory needed to sustain a normal real estate market is approximately six months. Anything more than that is an overabundance and will causes prices to depreciate. Anything less than that is a shortage and will lead to continued price appreciation.

For historical context, there were too many homes for sale during the housing crisis (many of which were short sales and foreclosures), and that caused prices to tumble. Today, supply is growing, but there’s still a shortage of inventory available.

The graph below uses data from the National Association of Realtors (NAR) to show how this time compares to the crash. Today, unsold inventory sits at just a 3.0-months’ supply at the current sales pace.

3 Graphs To Show This Isn’t a Housing Bubble | MyKCM

One of the reasons inventory is still low is because of sustained underbuilding. When you couple that with ongoing buyer demand as millennials age into their peak homebuying years, it continues to put upward pressure on home prices. That limited supply compared to buyer demand is why experts forecast home prices won’t fall this time.

Mortgage Standards Were Much More Relaxed During the Crash

During the lead-up to the housing crisis, it was much easier to get a home loan than it is today. The graph below showcases data on the Mortgage Credit Availability Index (MCAI) from the Mortgage Bankers Association (MBA). The higher the number, the easier it is to get a mortgage.

3 Graphs To Show This Isn’t a Housing Bubble | MyKCM

Running up to 2006, banks were creating artificial demand by lowering lending standards and making it easy for just about anyone to qualify for a home loan or refinance their current home. Back then, lending institutions took on much greater risk in both the person and the mortgage products offered. That led to mass defaults, foreclosures, and falling prices.

Today, things are different, and purchasers face much higher standards from mortgage companies. Mark Fleming, Chief Economist at First Americansays:

Credit standards tightened in recent months due to increasing economic uncertainty and monetary policy tightening.” 

Stricter standards, like there are today, help prevent a risk of a rash of foreclosures like there was last time.

The Foreclosure Volume Is Nothing Like It Was During the Crash

The most obvious difference is the number of homeowners that were facing foreclosure after the housing bubble burst. Foreclosure activity has been on the way down since the crash because buyers today are more qualified and less likely to default on their loans. The graph below uses data from ATTOM Data Solutions to help tell the story:

3 Graphs To Show This Isn’t a Housing Bubble | MyKCM

In addition, homeowners today are equity rich, not tapped out. In the run-up to the housing bubble, some homeowners were using their homes as personal ATMs. Many immediately withdrew their equity once it built up. When home values began to fall, some homeowners found themselves in a negative equity situation where the amount they owed on their mortgage was greater than the value of their home. Some of those households decided to walk away from their homes, and that led to a wave of distressed property listings (foreclosures and short sales), which sold at considerable discounts that lowered the value of other homes in the area.

Today, prices have risen nicely over the last few years, and that’s given homeowners an equity boost. According to Black Knight:

In total, mortgage holders gained $2.8 trillion in tappable equity over the past 12 months – a 34% increase that equates to more than $207,000 in equity available per borrower. . . .”

With the average home equity now standing at $207,000, homeowners are in a completely different position this time.

Bottom Line

If you’re worried we’re making the same mistakes that led to the housing crash, the graphs above should help alleviate your concerns. Concrete data and expert insights clearly show why this is nothing like the last time.