

 Facebook
 X
X
 Pinterest
 Copy Link
This week’s market report for Snohomish and North King County has a few things going on at once. Before we get into the numbers, there is a quick housekeeping note worth reading.
A New Metric Joins the Tracking: First Look
NWMLS introduced a new listing type this week called First Look. These are homes that become visible to select buyers before they go fully live on the MLS — a pre-launch window of sorts. Starting this week, we will count First Look listings alongside standard new listings as our total new supply figure.
This matters for how we read the data. Standard new listings came in at 211 this week, which looks like a big drop from 360 last week. But once you add the 26 First Look listings, total new supply is 237. The drop is still real, just not as dramatic as the new listings number alone suggests.
Going forward, all gap calculations will use combined supply (First Look + New Listings).
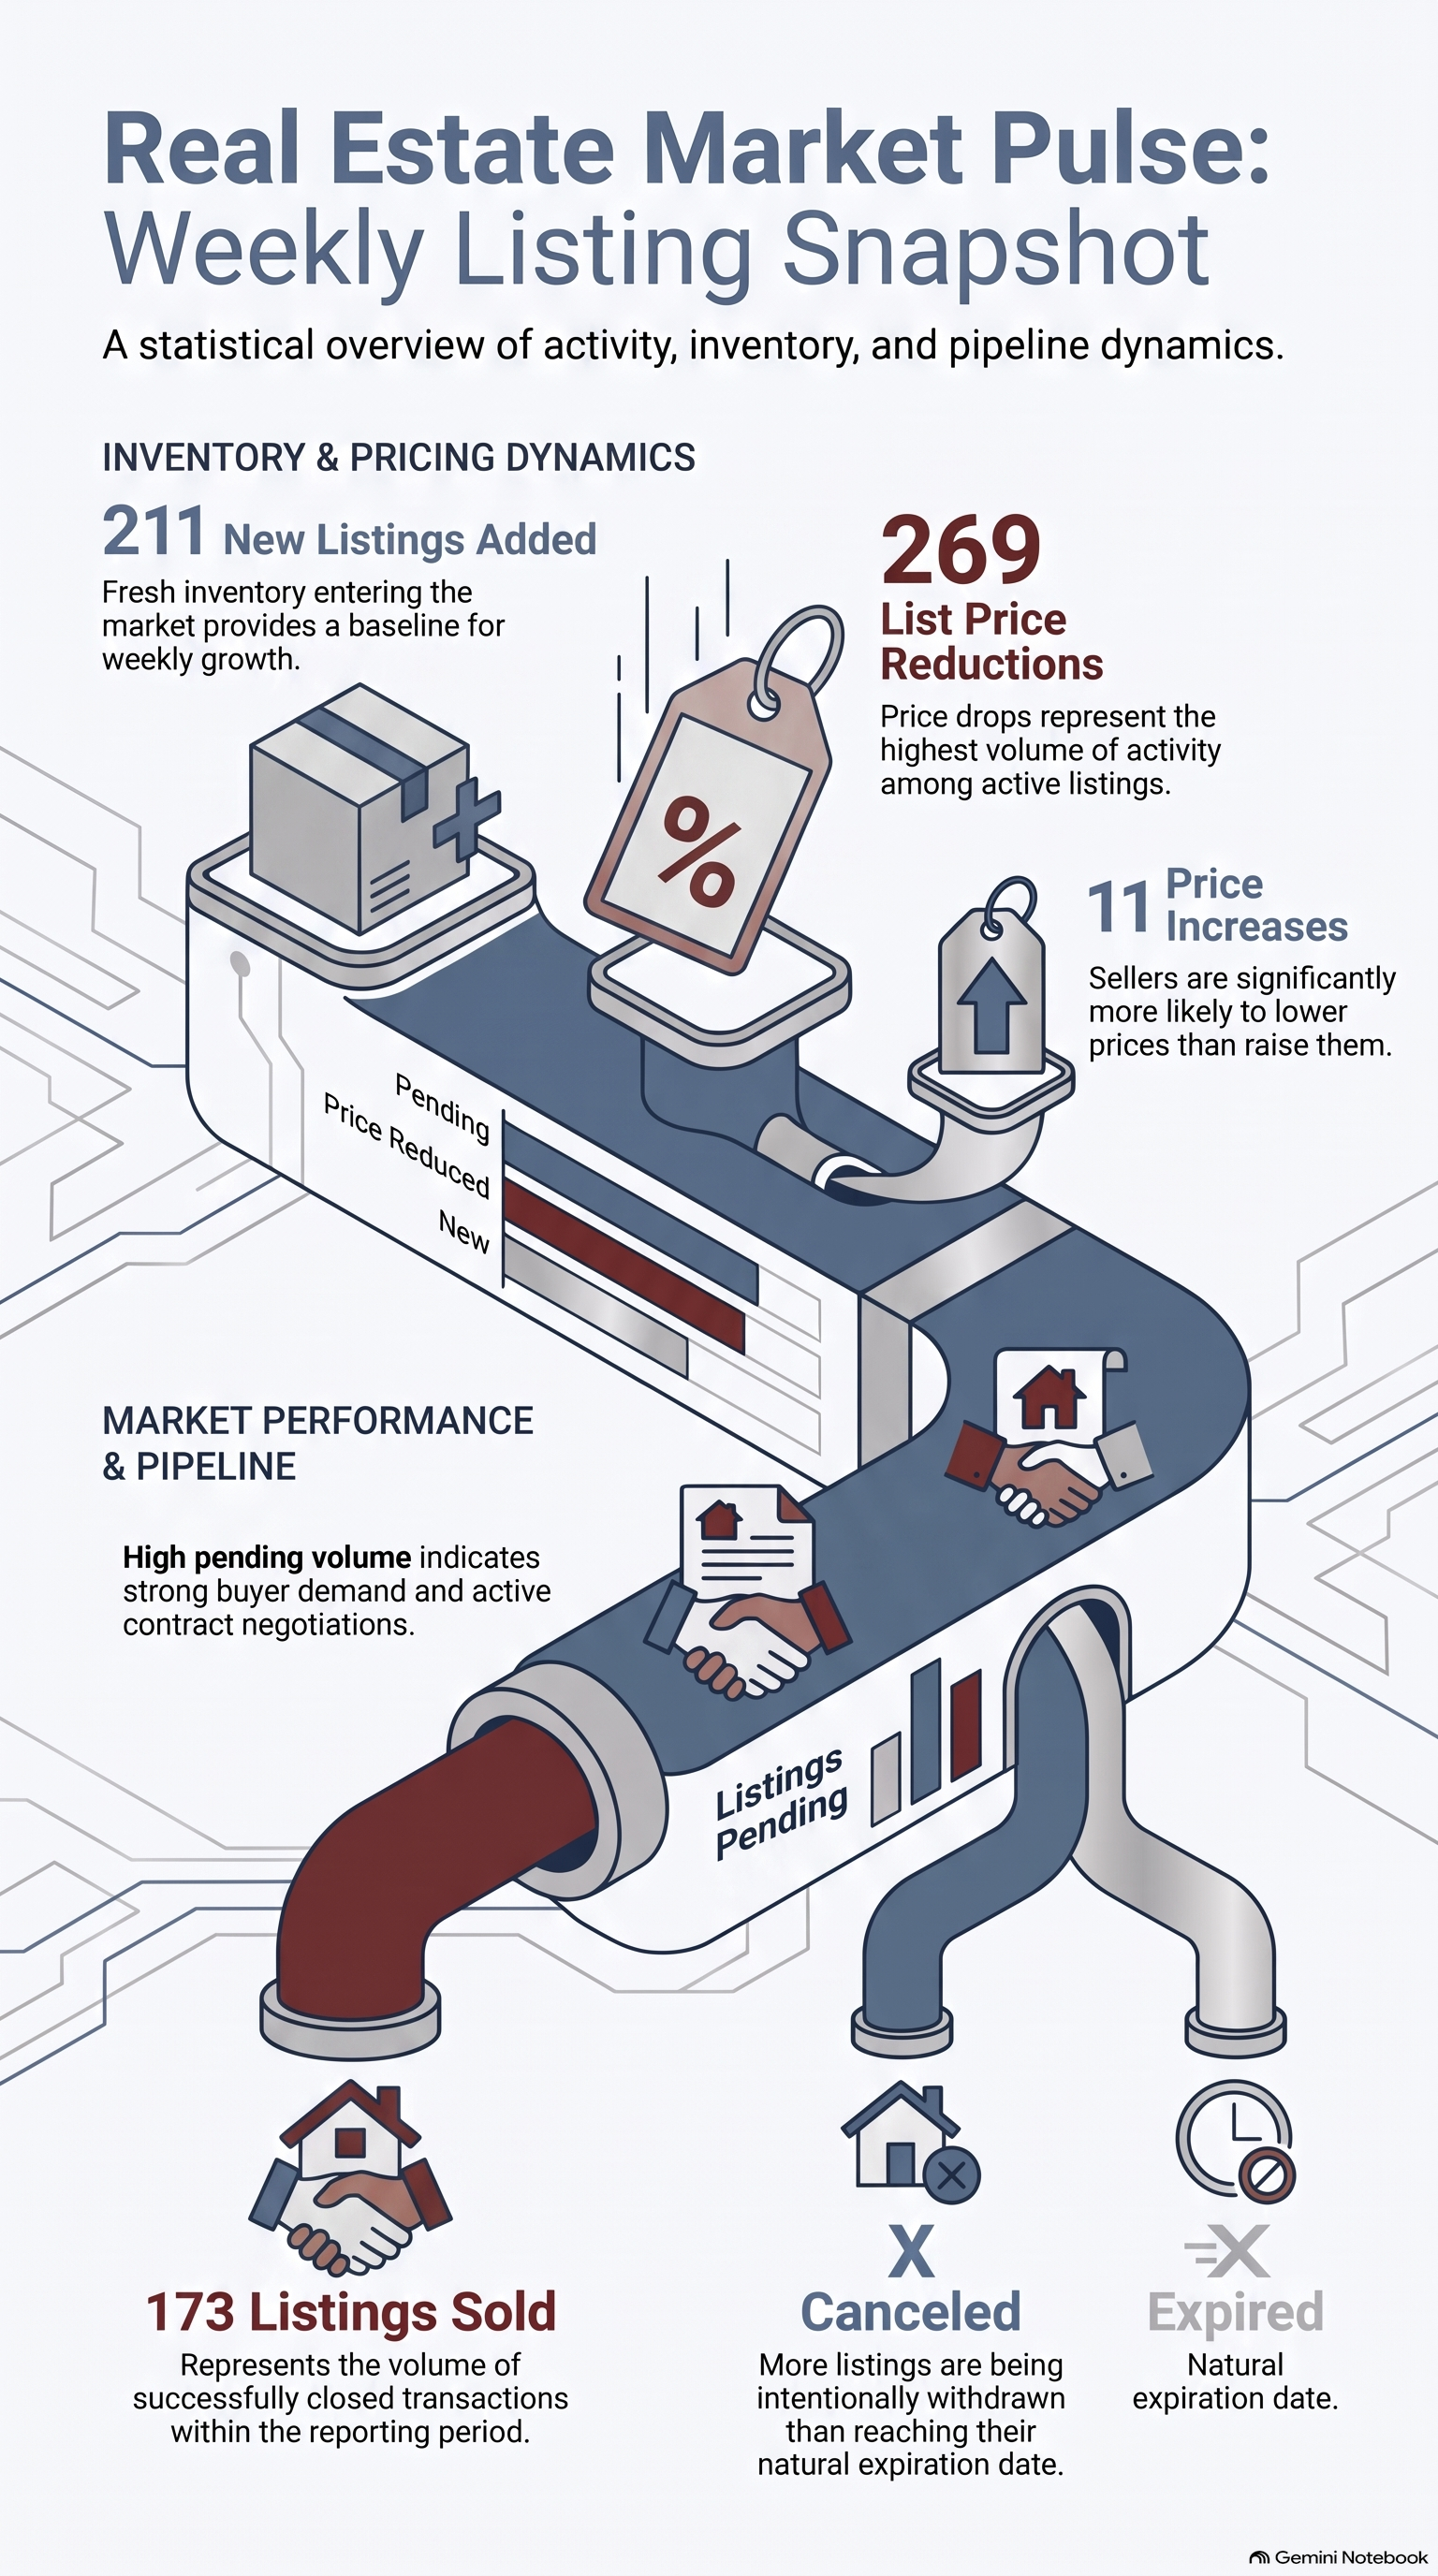
This Week’s Numbers (Week Ending August 23, 2026)
- 26 First Look Listings (new)
- 211 New Listings (237 combined with First Look, down from 360)
- 279 Pending Sales (up 4% from 267)
- 173 Homes Sold (down 13%, lowest in our tracking period)
- 269 Price Reductions (down 14%, lowest non-holiday week in our tracking)
- 11 Price Increases (flat)
- 52 Back on Market (up 63%, new high)
- 71 Expired Listings (up 39%, new high overall)
- 91 Canceled Listings (down 26%)
- 2 Contingent
For the First Time This Summer, Demand Outpaced Supply
Using combined new supply of 237, pending sales at 279 outpaced new listings by 42 homes. That is the first time that has happened outside of the July 4th holiday since we started tracking in mid-June.
That is a meaningful signal. For most of the summer, new listings have been flooding the market faster than buyers could absorb them. This week, buyers absorbed more than what came in. Part of that is a supply drop — fewer listings came to market this week. But pending also ticked up, so demand did its part too.
The gap trend across our full tracking period now looks like this:
Week of 6/16: +40 homes (supply ahead) Week of 6/21: +84 homes Week of 6/28: +143 homes Week of 7/5: -116 homes (July 4th holiday) Week of 7/12: +167 homes (peak) Week of 7/19: +85 homes Week of 7/26: +98 homes Week of 8/2: +146 homes Week of 8/9: no data Week of 8/16: +93 homes Week of 8/23: -42 homes (demand ahead, using combined supply)
Price Reductions Just Hit a New Low
This is the most consistently positive trend in the data right now. Price reductions have dropped every week since the August 2 peak of 401. This week they came in at 269 — the lowest non-holiday reading in our entire tracking series.
To put that in context: the only week with fewer price reductions was July 5th, the holiday week, when the whole market slowed down artificially. Every normal week before this one had higher reductions than 269.
That tells us something important. Sellers are coming to market more realistically priced. Fewer of them are needing to cut after the fact. And the homes that are priced right are moving, which is why pending held up despite fewer listings coming to market.
The Concerns Are Real Too
It would not be a full picture without the other side. Sold homes at 173 is the lowest in our tracking period. Late August tends to be slow for closings — deals that went under contract in early August often close in September — so some of this is timing. But it is worth watching.
Expired listings jumped to 71, a new high for our entire series. Back on market hit 52, also a new high. Both of those tell you there is a segment of the market — older listings priced above what buyers will pay — that is still struggling. The overall trend in price reductions is improving, but not every seller has gotten the message yet.
What This Means If You’re Selling
The three-week drop in price reductions is the best signal the data has offered sellers all summer. Buyers are rewarding homes that come in at the right price. And with demand outpacing supply this week, there is less competition than at almost any point this summer.
That window will not stay open indefinitely. Historically, fall tends to bring a pickup in both listings and buyer activity. Getting into the market before that wave hits — and priced correctly — puts you in a strong position.
What This Means If You’re Buying
Demand outpacing supply is a signal that the pace of the market is shifting. It does not mean a return to the frantic competition of a couple years ago. But it does mean acting on the right home when you find it rather than assuming you have unlimited time.
The good news: expired listings and back on market numbers are still elevated. There are motivated sellers out there, and the price reduction trend means more of them are priced where buyers need them to be.
The Bottom Line
This week brought two meaningful shifts: price reductions hit their lowest non-holiday level of the summer, and demand outpaced supply for the first time since the holiday. Both are genuinely positive signals.
The data is not all clean. Sold homes are soft and expirations hit a new high. But the overall direction is more encouraging than it has been at most points this summer.
We also now have a new metric to track with First Look. We will continue to report combined supply going forward so the comparisons stay consistent.
Reach out anytime if you want to talk through what this means for your specific plans.
Data sourced from Snohomish & North King County MLS activity, week ending August 23, 2026. First Look is a new NWMLS listing type introduced this week and will be tracked alongside standard new listings as combined new supply going forward.

