

 Facebook
 X
X
 Pinterest
 Copy Link
Quick note before we get into the numbers. We missed last week’s update, so this week’s data compares to two weeks ago (August 2) rather than one week. That matters when you read the percentage changes below — a two-week gap makes some moves look larger than they might be on a week-over-week basis. I will call that out where it’s relevant.
With that said, there is a real story in this week’s data worth talking about.
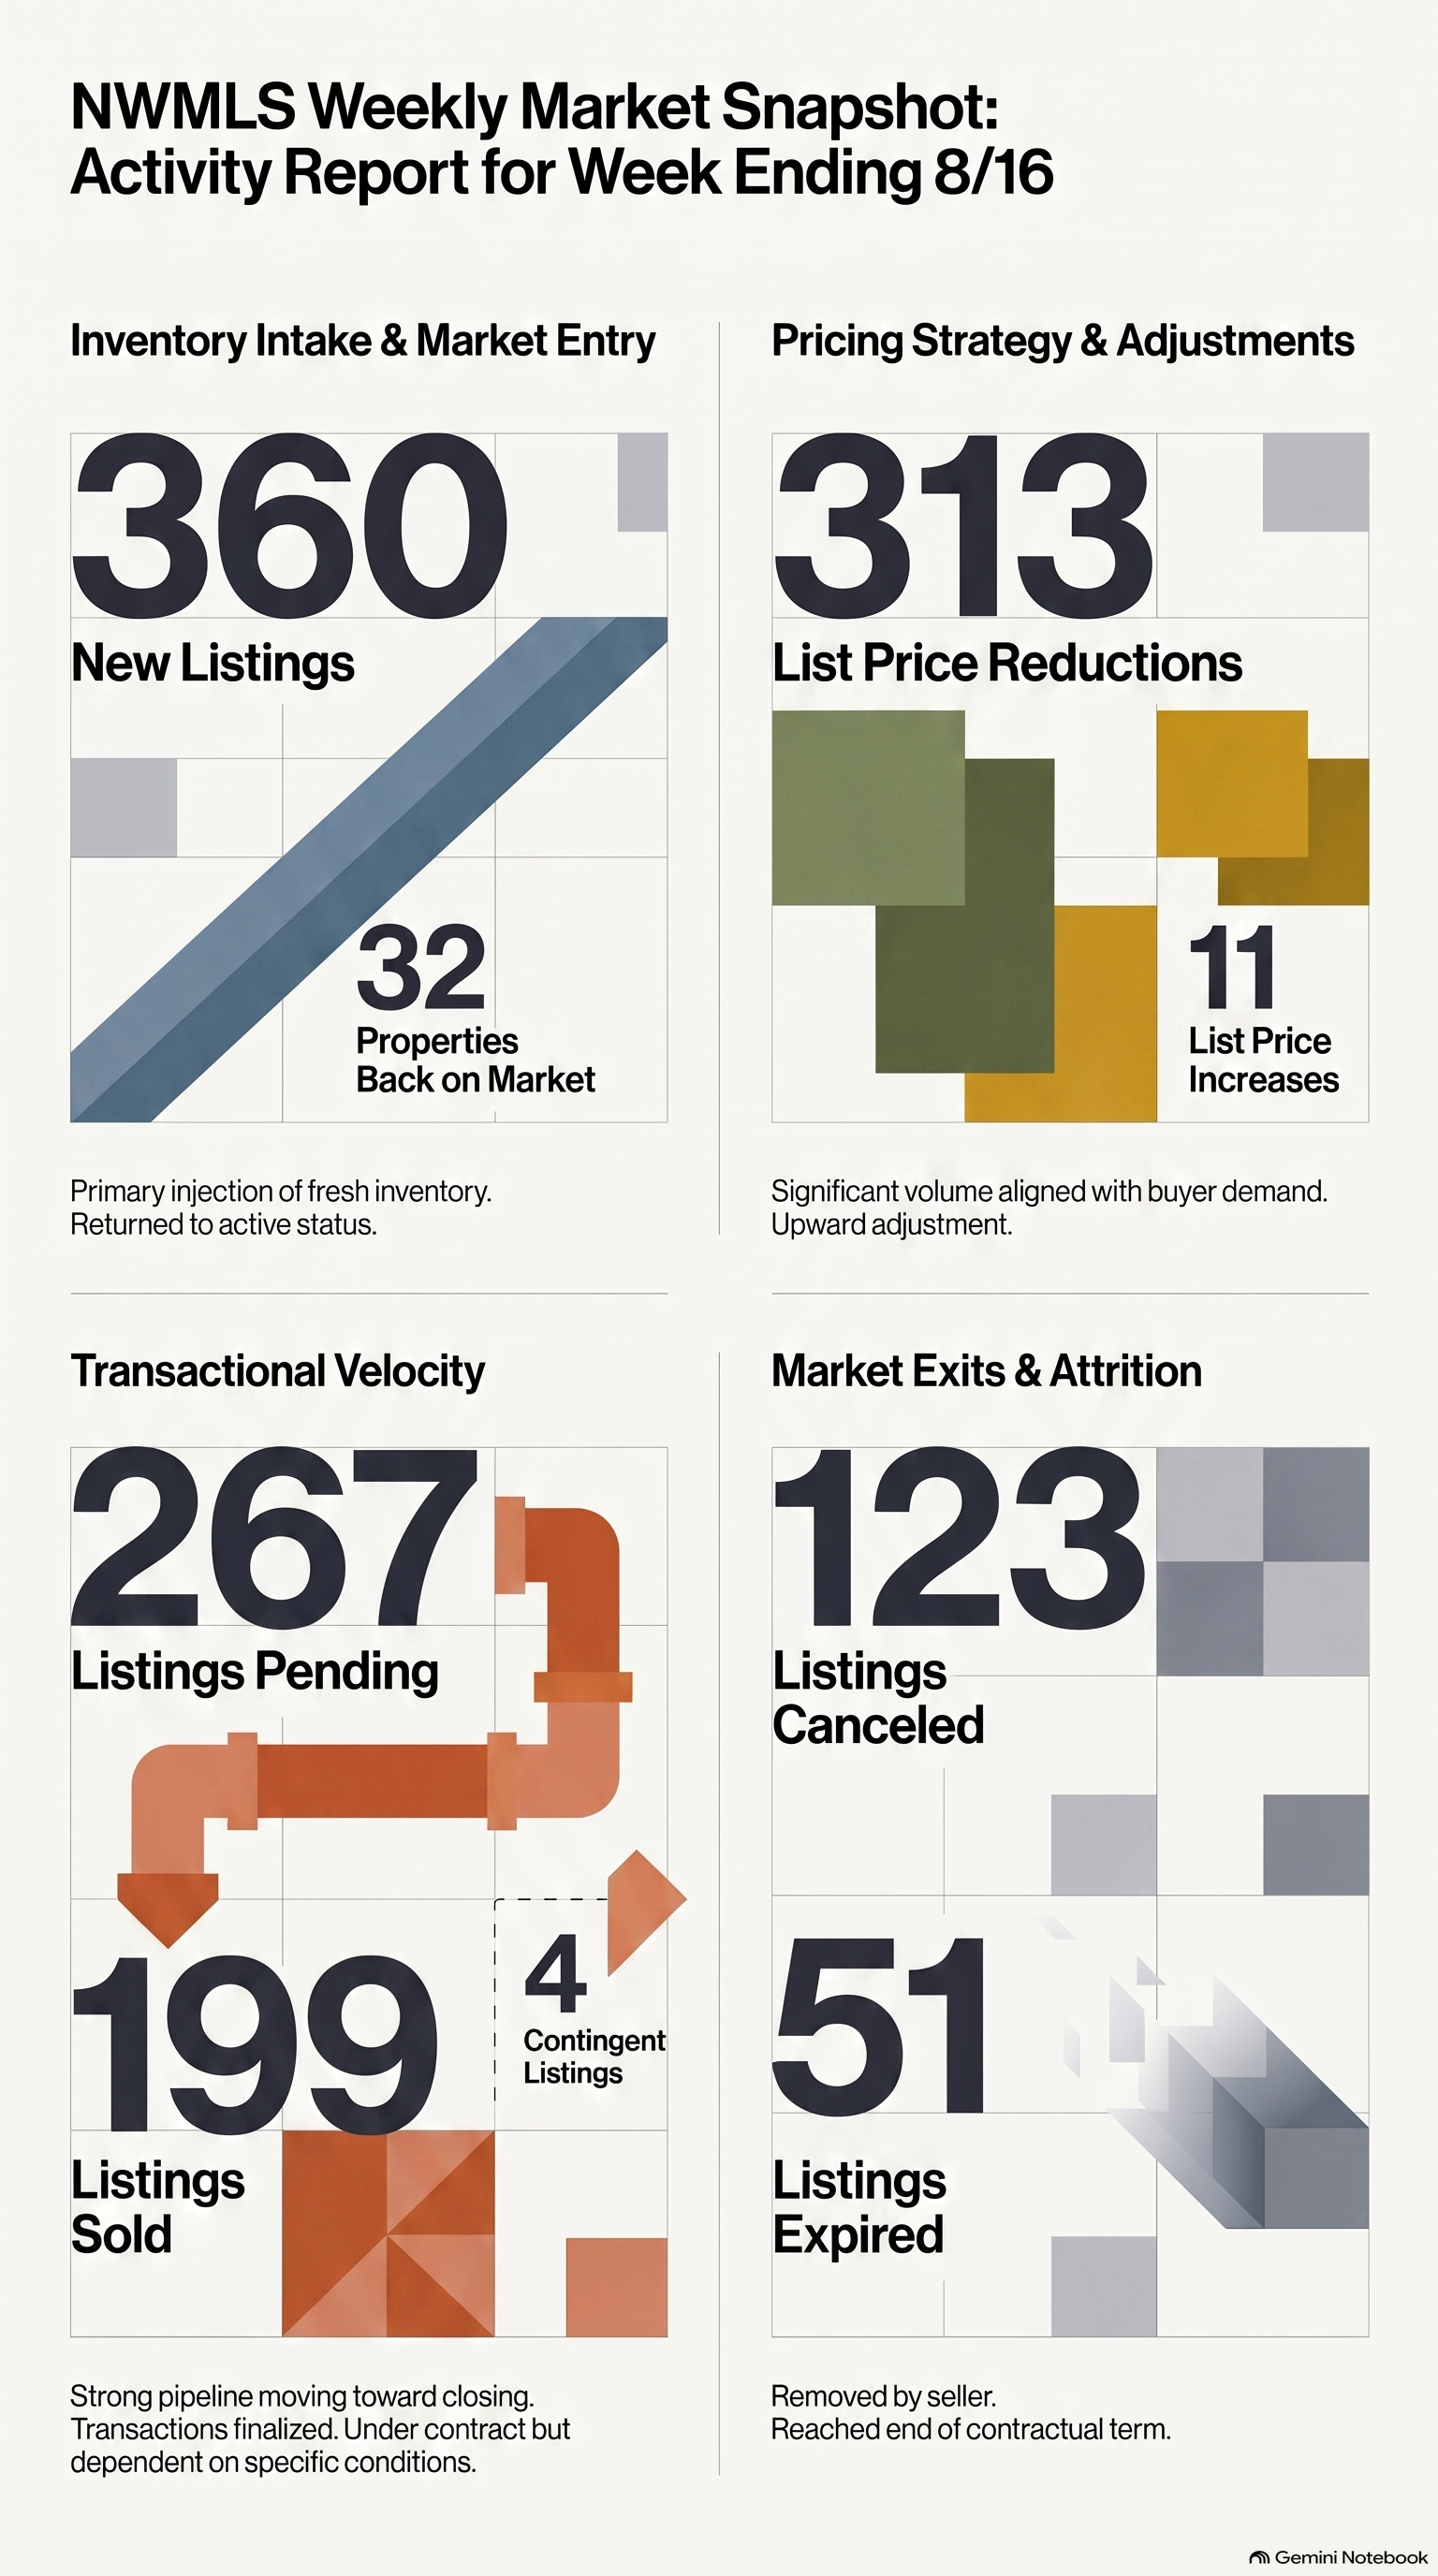
This Week’s Numbers (Week Ending August 16, 2026)
- 360 New Listings (down from 464 two weeks ago)
- 267 Pending Sales (down from 318, lowest in our tracking period)
- 199 Homes Sold (down from 261, lowest in our tracking period)
- 313 Price Reductions (down 22% from 401, lowest non-holiday week since late June)
- 11 Price Increases (down from 22)
- 32 Back on Market (flat)
- 51 Expired Listings (up from 37)
- 123 Canceled Listings (down from 138)
- 4 Contingent
The Price Reduction Drop Is Real
Price reductions came in at 313 this week, down 22% from the record high of 401 two weeks ago. Excluding the July 4th holiday week, that is the lowest we have tracked in this series. You have to go back to the week of June 21 to find a lower number, when reductions came in at 312.
That is a meaningful move, even accounting for the two-week gap. It tells us that fewer sellers are needing to cut price to compete right now. Some of that is because fewer homes are on the market overall — new listings eased from 464 to 360. But it also reflects sellers coming to market more realistically priced than they were at the peak in early August.
Buyer Activity Is at Its Quietest Point of the Summer
Here is the part that balances the positive price reduction news. Pending sales at 267 and sold homes at 199 are the lowest numbers we have tracked in our series this summer.
Some of that is the two-week comparison. But late August traditionally brings a seasonal dip in buyer activity as families finish summer travel and the back-to-school period absorbs attention. That seasonal pattern is likely showing up in these numbers alongside any genuine softening in demand.
The gap between new listings and pending sales narrowed to 93 homes this week. That is the second tightest gap in our tracking period, outside of the distorted holiday week and the strong week of June 16. So even with soft pending numbers, the supply-demand picture looks less extreme than it did two weeks ago.
The Full Picture Across 10 Weeks
Here is the gap trend since we started tracking in mid-June:
Week of 6/16: +40 homes Week of 6/21: +84 homes Week of 6/28: +143 homes Week of 7/5: -116 homes (July 4th holiday) Week of 7/12: +167 homes (peak) Week of 7/19: +85 homes Week of 7/26: +98 homes Week of 8/2: +146 homes Week of 8/9: no data Week of 8/16: +93 homes
The gap at 93 is the lowest it has been since mid-July, excluding the holiday. The overall trend since the July 12 peak has been inconsistent, but the average is clearly lower than it was at the height of the summer.
What This Means If You’re Selling
Price reductions dropping to their lowest non-holiday level in two months is genuinely encouraging. It suggests the market is reaching a more stable level and that sellers who price correctly from the start are not being forced into cuts.
That said, buyer activity is quiet right now. Seasonal softening in late August is normal, and it tends to pick back up as fall gets going. If you are thinking about listing soon, it is worth having a conversation about timing. Fall can be a strong window when inventory starts to thin out and serious buyers are back from summer.
What This Means If You’re Buying
The combination of the lowest price reduction count since June and the softest pending numbers of the summer creates an interesting moment for buyers. Sellers who have been on the market for a while are more realistic on price than they were a month ago. And with fewer competing buyers active right now, there is real room to negotiate.
If you have been watching the market and waiting for the right moment, late summer and early fall often offer a window that does not last long once activity picks back up.
The Bottom Line
This week’s numbers are mixed, and the two-week gap makes them harder to read with precision. But the direction on price reductions is real and worth noting. Sellers are getting more realistic. Buyer activity is seasonally quiet. The gap between supply and demand has narrowed.
We’ll be back to weekly tracking from here and will have a cleaner comparison next week.
Reach out anytime if you want to talk through what this means for your situation. Happy to walk through it with you.
Data sourced from Snohomish & North King County MLS activity, week ending August 16, 2026. Week ending August 9 was not tracked.

